
In Power BI, a datamart is a small, focused data warehouse that contains a subset of an organization's data. It is designed to serve a specific business function or department, such as sales or finance.
Introduction of Datamart PowerBI (Preview)
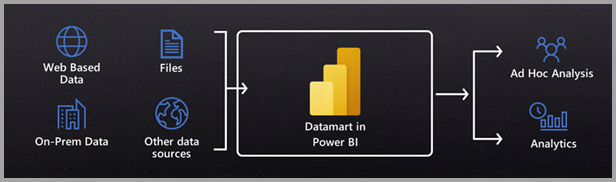
Datamart in Power BI (Preview) is a feature that allows users to create and manage datamarts directly in Power BI. With this feature, users can create a custom datamart that contains a subset of data from their organization's data sources, and then use Power BI to create reports and visualizations based on that data.
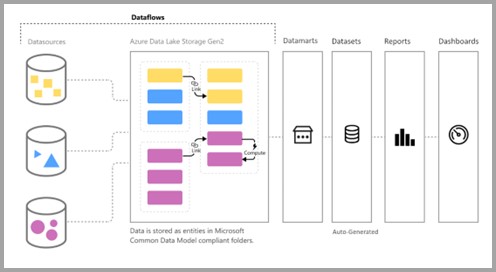
Datamart in Power BI (Preview) simplifies the process of creating a datamart by providing a user-friendly interface and tools for extracting, transforming, and loading data. Users can connect to a variety of data sources, including cloud-based and on-premises databases, and then use Power Query to transform and shape the data to fit the needs of their datamart. Once the data is loaded into the datamart, users can create reports and visualizations in Power BI to analyze the data and gain insights.
Some of the key benefits of using Datamart in Power BI (Preview) include:
- Simplified datamart creation: Datamart in Power BI (Preview) provides a streamlined process for creating a datamart, without the need for specialized technical skills or expertise.
- Customization: Users can create a datamart that is tailored to their specific business needs and requirements.
- Improved data management: Datamart in Power BI (Preview) allows users to easily manage and update their datamart as their data sources and business needs change.
- Faster insights: By creating a custom datamart that is optimized for their specific data needs, users can gain insights more quickly and make faster, more informed decisions.
How to we create a datamart powerbi?
To create a datamart in Power BI, follow these steps:
- Identify the business requirements: Determine the specific data needs of the department or function that the datamart will serve.
- Define the data model: Create a conceptual model that outlines the tables and relationships that will be included in the datamart.
- Extract, transform, and load (ETL) the data: Extract the necessary data from the organization's data sources, transform it to fit the datamart's schema, and load it into the datamart.
- Build the Power BI report: : Create a report that presents the data in a meaningful way, using visualizations and other tools to help users gain insights into the data.
- Publish the report: Share the report with the appropriate users or groups, either within the organization or externally
Follow our work

Contact Us
Build hyper-competitive, products
& services for your
organization.


Have a Questions
